See also problem
Problemè 1
1.a
What does a root locus plot depict?
A root locus plot depicts locations of the closed-loop poles of a system in the complex -plane as a function of a gain parameter, commonly the controller gain
- represents how the roots (poles) of the closed-loop characteristic equation move in the complex plane is varied from
- root locus starts at open-loop poles when and ends at open-loop zzeros when
- shape determines stability and transient response characteristics of the closed-loop system
- Points on root locus satisfy angle condition and magnitude condition in relation to the open-loop transfer function.
1.b
What must be done to a transfer function before its root locus can be graphed?
- find the open-loop poles and zeros of , or solving . The poles are the roots of the denominator polynomial, and the zeros are the roots of the numerator polynomial.
- determine the number of branches of the root locus, which is equal to the number of poles minus number of zeros
- Check for root locus existence on the real axis.
- Determine breakaway and break-in points where root locus departs from and arrives on the real axis, via solving , where K is the open-loop gain
- Calculate asymptote centroid and angles. Centroid is the center of gravity of the poles and zeros. Asymptote angles are given by where
- Determine angle of departure and arrival at complex poles and zeros using angle condition.
1.c
What is the significance of the gain ?
K represents the variable loop gain in feedback control system. Since root locus starts at open-loop poles when and ends at open-loop zeros as , thus K determines the trajectory of closed-loop poles.
The stability and transient response characteristics of the closed-loop system depend on pole locations, which is determined by K. For example:
- If poles are in the right-half plane for a certain K, the system is unstable.
- Poles further from the origin (higher K) give faster response.
- Poles with larger imaginary parts (higher K) produce more oscillations.
Finally, K can be selected to achieve target spec like damping ratio, settling time, to shape system response via gain tuning
1.d
How can a root locus plot be used to design a controller?a\
- Selecting K gain: root locus show trajectories of closed-loop poles as K varies. By selecting K, the desired pole locations can be achieved to meet the desired transient response characteristics.
- Assessing stability: root locus allow determine range of K for which the closed-loop system is stable. System is stable if all poles lie in the left-half plane. Segments of the real axis to the left of an odd number of poles and zeros are part of the root locus.
- Adding poles and zeros: If original root locus does not pass through the desired closed-loop pole locations, poles and zeros can be added via the controller to reshape the root locus (lead compensators add zeros and lag compensators add poles)
- Meeting spec: Lines of constant damping ratio and natural frequency can be drawn on the root locus to meet the desired transient response characteristics.
- Improve steady-state error: Adding poles at the origin or close to it with PI or lag controllers increases the system types and reduces steady-state error.
1.e
Imagine we have a partially finished root locus plot where only the pole and zero locations have been plotted. What are the rules for completing the root locus plot using pencil and paper?
-
Number of branches:
- Number of branches of the root locus is equal to the number of poles minus the number of zeros.
- Branches start at poles and end at the zeros
-
Symmetry:
- Root locus is symmetrical about the real axis
-
Real axis segments:
- Portions of the real axis are part of the root locus if the number of real poles and zeros to the right is odd
-
Asymptotes as :
- Asymptotes intersect at the centroid of the poles and zeros, and the angles are given by where
-
Breakaway and break-in points:
- Breakaway and break-in points where the locus departs from or arrives on the real axis can be found by solving for. They are found by solving .
Problemè 2
For each of the following transfer functions, sketch a root locus plot using the pencil-and-paper method you outlined above:
2.a
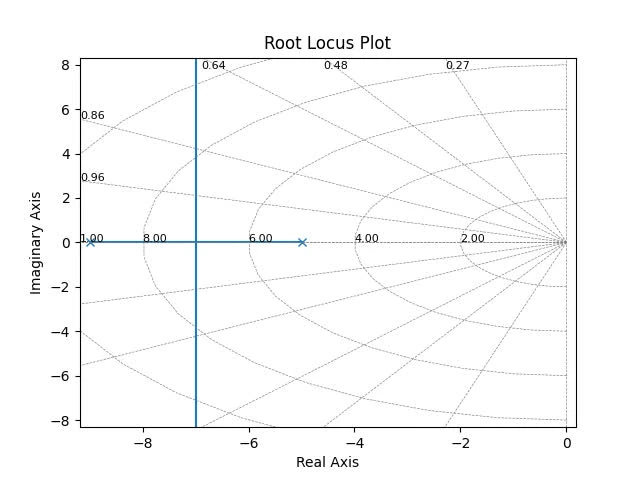
poles: , zeros:
branches: 2 ()
asymptotes: for
Centroid:
root locus on real axis: exists to the left of -5 and -9
breakaway, angle of departure/arrival: not applicable since no complex zeros
locus is symmetrical about the real axis

2.b
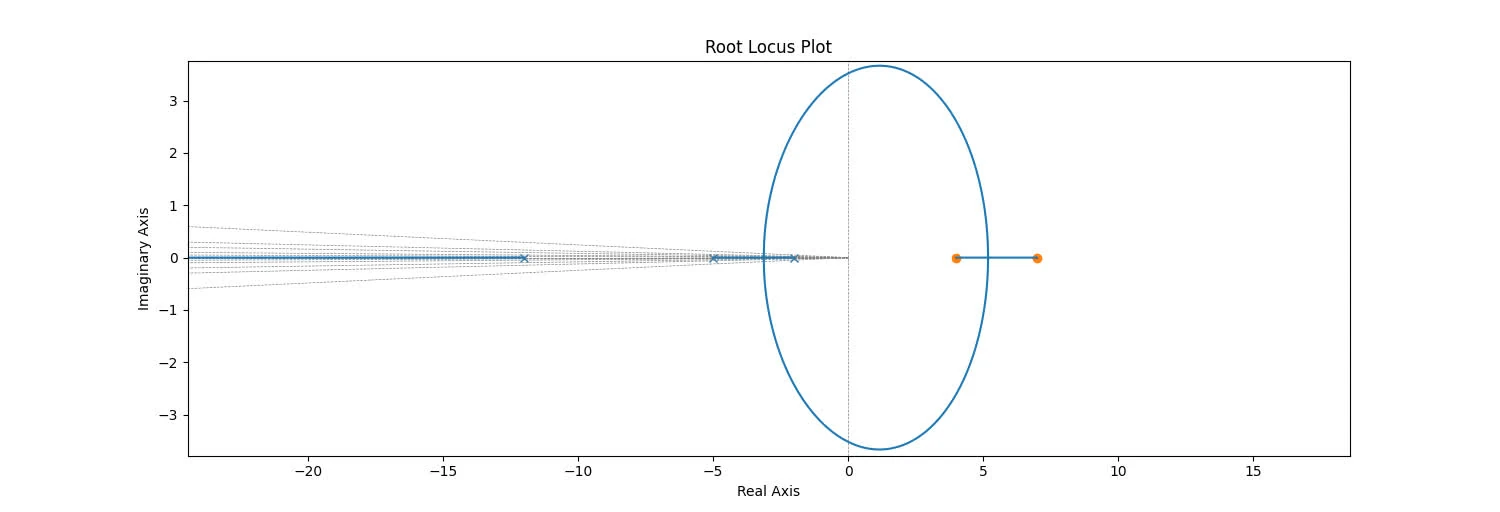
poles: , zeros:
branches: 3 ()
asymptotes: for
centroid:
root locus on real axis: on the axis from 7 to 4, and from -2 to -5, and from -12 to .
breakways/break-in points: solve for , There are around two breakaways point, at

2.c
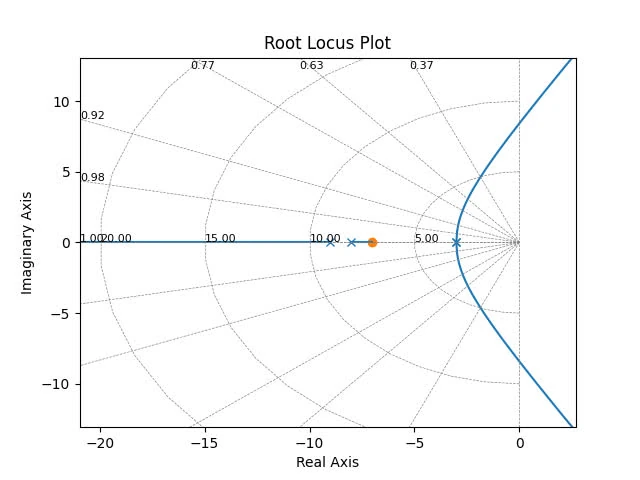
poles: , zeros:
branches: 4 ()
asymptotes: for
centroid:
root locus on real axis: on the axis from -3 to -3, and from -7 to -8, and from -9 to .
breakaways/break-in points: at , which solves for
